 |
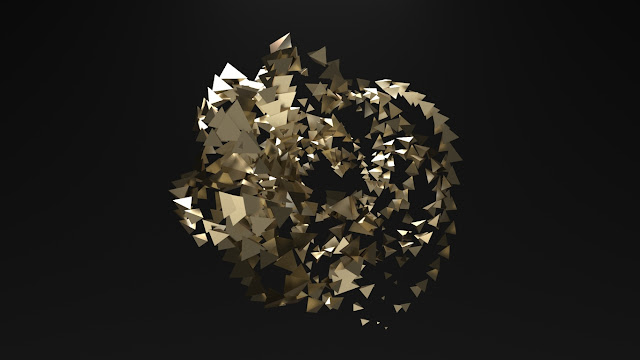
| Visualising Romeo & Juliet / R&D / Deanna Crisbacher |
Following Computer Animation Arts' animated adaptation of Benjamin Britten's The Young Person's Guide To The Orchestra, comes Hector Berlioz's Romeo & Juliet (1839). In common with our previous visualisations of classical music, our resulting animated response to Berlioz's composition will be screened live at concerts in Katowice, Poland in February 2019 and in Amiens and Soissons, France in March. In contrast to Red & The Kingdom Of Sound, this final visualisation of sound will be non-narrative, focusing instead on data visualisation and CG simulations. The four parts of Berlioz's composition are showcased below.
The provisional methodology of the project is outlined within the following presentation: put simply, we're hoping to use Berlioz's music as an agent by which we can create animated simulations from datasets that pertain thematically to each of the four pieces of music. For example, I've been working with an academic at Harvard University who is an expert of dreams and dreaming, and who has compiled numerical data sets relating to the different constituents of individuals' dreams. By taking Berlioz's La Reine Mab ou la fee des songes (aka Queen Mab, Queen Of Dreams) and using it to visually activate the dream data, we're hoping we can create abstract animations that synch with the music accordingly.
Once again, I'll be working with CAA alumni, Ethan Shilling - a creative force with which to be reckoned! - who is currently investigating all the likely ways by which we might use Berlioz's music to visualise the different data sets for each of the four movements of Romeo & Juliet. Below is Ethan's very first excursion into using Autodesk Maya as the mediator between sound and image.
Recent CAA graduate, Deanna Crisbacher, is likewise joining the project, her mission to ensure our resulting simulations are things of beauty! Again, it's incredibly early days, but Dee's already been tinkering around with Ethan's original simulation to interesting effect!
This is the inaugural post for our new visualisation project - expect more frequent updates from this point forward! Watch this space!


